Centerra Gold Inc. (Centerra) and Kumtor Gold Company (KGC) have summed up their operating results in the second quarter of 2018. In the first six months of 2018, KGC produced 184,023 ounces¹ or 5723.76 kg of gold and contributed more than 3.65 billion soms in taxes and mandatory payments. The Media Relations Department of the company reported.
Gold production and sales
Kumtor produced 83,803 ounces of gold in the second quarter of 2018 compared to 138,623 ounces of gold in the same period of 2017. The decrease in ounces poured is a result of processing the stockpiled ore from the Sarytor Pit which is lower in grade and recovery, as compared to the stockpiled ore processed from cut-back 17 in the comparative period of 2017. During the second quarter of 2018, Kumtor’s average mill head grade was 2.27 g/t with a recovery of 70.3% compared to 3.53 g/t and a recovery of 79.3% for the same period in 2017.
Gold sales in the second quarter of 2018 were 90,620 ounces, or 2.82 tonnes. Total revenues from gold sales in the second quarter of 2018 were $117.3 million2.
The Dore bars produced by the Kumtor mine are purchased by Kyrgyzaltyn JSC for processing at the Kara-Balta refinery pursuant to a Gold and Silver Sales Agreement signed by KGC, Kyrgyzaltyn and the Government of the Kyrgyz Republic. Kyrgyzaltyn JSC enjoys the exclusive right to sell refined gold and silver both within and outside the Kyrgyz Republic.
Operating costs and All-in Measures
Operating costs (on a sales basis)4, including capitalized stripping, decreased in the second quarter of 2018 by $5.7 million to $81.0 million compared to $86.7 million in the same period of 2017. The movements in the major components of operating costs (mining, milling and site support), including capitalized stripping but before changes in inventory, is explained below.
Mining costs, including capitalized stripping
Mining costs, including capitalized stripping, totaled $53.6 million in the second quarter of 2018, which was $5.3 million higher than the comparative quarter in 2017. Increased costs for second quarter of 2018 includes higher diesel costs ($7.2 million), which was due to higher fuel prices and higher consumption resulting from increased haulage distance and heavy equipment productivity hours, and higher labour costs ($0.6 million) mainly due to unfavorable exchange rate fluctuation. Higher costs were partially offset by lower maintenance costs ($2.9 million) resulting from more repairs on the haul trucks and Liebherr shovels conducted in the second quarter of 2017, as compared to the same period of 2018.
Milling costs
Milling costs amounted to $16.6 million in the second quarter of 2018 compared to $16.5 million in the comparative quarter of 2017. Higher mill reagents costs ($1.1 million) primarily resulting from increased mill throughput, were partially offset by lower maintenance activities performed during the second quarter of 2018.
Site support costs
Site support costs in the second quarter of 2018 totalled $12.8 million compared to $11.3 million in 2017. The increase is attributable primarily to higher costs for food and other supplies, partially offset by lower insurance premiums.
Other cost movements
Depreciation, depletion and amortization (“DD&A”) associated with sales decreased to $31.4 million in the second quarter of 2018 from $41.0 million in the comparative period, mainly due to fewer ounces sold. All-in sustaining costs on a by-product basis per ounce sold4, which excludes revenue-based tax, was $1,071 in the second quarter of 2018 compared to $782 in the same period of 2017. The increase was mainly due to lower ounces sold, that was partially offset by lower capitalized stripping costs. Including revenue-based taxes, all-in sustaining costs on a by-product basis per ounce sold4 was $1,254 in the second quarter of 2018 compared to $959 in the same period of 2017. The increase was mainly due to higher all-in sustaining costs4, partially offset by lower revenue-based taxes resulting from lower sales revenue in the second quarter of 2018.
Operating results of the Kumtor
|
($ millions, except as noted)з |
Three months ended June 30 |
Six months ended June 30 |
|||||||||
|
2018 |
2017 |
% Change |
2018 |
2017 |
% Change |
||||||
|
Financial highlights: |
|||||||||||
|
Revenue - $ millions |
117.3 |
168.6 |
(30%) |
270.3 |
332.8 |
(19%) |
|||||
|
Cost of sales (cash) |
44.4 |
39.3 |
13% |
87.0 |
74.4 |
17% |
|||||
|
Cost of sales (non-cash) |
31.4 |
41.0 |
(23%) |
67.1 |
78.2 |
(14%) |
|||||
|
Cost of sales (total) |
75.8 |
80.3 |
(6%) |
154.1 |
152.6 |
1% |
|||||
|
Cost of sales - $/oz sold 4 |
836 |
593 |
41% |
742 |
566 |
31% |
|||||
|
Cash provided by operations |
52.9 |
93.7 |
(44%) |
95.9 |
184.7 |
(48%) |
|||||
|
Cash provided by operations before changes in working capital4 |
52.0 |
102.6 |
(49%) |
136.6 |
205.0 |
(33%) |
|||||
|
Operating highlights: |
|||||||||||
|
Tonnes mined - 000s |
43,493 |
42,855 |
1% |
90,807 |
81,857 |
11% |
|||||
|
Tonnes ore mined – 000s |
957 |
12 |
7571% |
2,361 |
12 |
18830% |
|||||
|
Average mining grade - g/t |
1.72 |
1.63 |
5% |
1.90 |
1.63 |
16% |
|||||
|
Tonnes milled - 000s |
1,571 |
1,537 |
2% |
3,239 |
3,072 |
5% |
|||||
|
Average mill head grade - g/t |
2.27 |
3.53 |
(36%) |
2.43 |
3.53 |
(31%) |
|||||
|
Mill Recovery - % |
70.3% |
79.3% |
(11%) |
71.4% |
77.6% |
(8%) |
|||||
|
Mining costs - total ($/t mined material) |
1.23 |
1.13 |
9% |
1.15 |
1.17 |
(2%) |
|||||
|
Milling costs ($/t milled material) |
10.55 |
10.75 |
(2%) |
9.89 |
10.40 |
(5%) |
|||||
|
Gold produced – ounces |
83,803 |
138,623 |
(40%) |
184,023 |
266,024 |
(31%) |
|||||
|
Gold produced – kg |
2606.57 |
4311.66 |
(40%) |
5723.76 |
8274.28 |
(31%) |
|||||
|
Gold sold – ounces |
90,620 |
135,235 |
(33%) |
207,539 |
269,917 |
(23%) |
|||||
|
Gold sold – kg |
2818.60 |
4206.28 |
(33%) |
6455.19 |
8395.36 |
(23%) |
|||||
|
Average realized gold price 4- $/oz sold |
$ |
1,294 |
$ |
1,247 |
4% |
$ |
1,302 |
$ |
1,233 |
6% |
|
|
Capital Expenditures (sustaining) 4- cash |
9.9 |
13.5 |
(27%) |
21.2 |
28.7 |
(26%) |
|||||
|
Capital Expenditures (growth) 4 |
- cash |
5.9 |
4.9 |
22% |
9.4 |
5.8 |
63% |
||||
|
Capital Expenditures (stripping) |
- cash |
36.6 |
47.4 |
(23%) |
65.3 |
94.2 |
(31%) |
||||
|
Capital Expenditures (stripping) |
- non-cash |
11.2 |
16.9 |
(34%) |
21.0 |
32.7 |
(36%) |
||||
|
Capital expenditures (total) |
63.6 |
82.7 |
(23%) |
116.9 |
161.3 |
(28%) |
|||||
|
Operating Costs (on a sales basis) 4 |
44.4 |
39.3 |
13% |
87.0 |
74.4 |
17% |
|||||
|
All-in sustaining costs (including taxes) 4 |
97.2 |
105.5 |
(8%) |
185.6 |
208.1 |
(11%) |
|||||
|
Adjusted operating costs 4- $/oz sold |
$ |
555 |
$ |
329 |
69% |
$ |
475 |
$ |
315 |
51% |
|
|
Operating Costs (on a sales basis)- $/oz sold4 |
$ |
495 |
$ |
288 |
72% |
$ |
421 |
$ |
274 |
53% |
|
|
Gold - All-in sustaining costs on a by-product basis - $/oz sold4 |
$ |
1,071 |
$ |
782 |
37% |
$ |
895 |
$ |
773 |
16% |
|
|
Gold - All-in sustaining costs on a by-product basis (including taxes) - |
|||||||||||
|
$/oz sold4 |
$ |
1,254 |
$ |
959 |
31% |
$ |
1,078 |
$ |
947 |
14% |
|
1 – One Troy ounce equals to 31.103 48 grammes.
2 – Unless specified otherwise, all dollar figures in this news release are in US dollars.
3– Numbers may not add up due to rounding
4- Non-GAAP measures and are discussed under “Non-GAAP Measures” in Centerra’s MD&A and news release dated August 1, 2018.
5- Financial extracted from Centerra’s news release.
Payments to the Kyrgyz national budget and mandatory contributions
During the second quarter of 2018, contributions to the national budget in taxes, deductions to the Social Fund and other mandatory payments have totaled 1.69 billion soms.
Kumtor’s contributions in taxes and mandatory payments for the first six months of 2018
|
As of June 30, 2018 |
USD |
|
|
Q1 |
Q2 |
|
|
Revenue-based tax |
21,991,326 |
20,026,766 |
|
Issyk-Kul Development Fund |
2,458,948 |
1,540,520 |
|
Pollution tax |
310,000 |
- |
|
Employee Income tax |
1,370,596 |
1,014,540 |
|
Social Insurance Fund |
2,259,310 |
1,930,322 |
|
Customs |
109,840 |
128,888 |
|
Tax on nonresident companies |
119,640 |
82,315 |
|
Other taxes and mandatory payments |
106,011 |
109,511 |
|
Total |
28,725,670 |
24,832,863 |
|
US$ official exchange rate to the Kyrgyz Soms as of June 30, 2018 |
68.4325 |
68.0600 |
|
Equivalent of payments effected in Kyrgyz Soms |
1,965,769,412 |
1,690,124,654 |
Note: Under the Agreement on New Terms dated as of April 24, 2009, the revenue-based tax and contributions to the Issyk-Kul Region Development Fund are estimated based on actual cash revenues from sales during the period under review.
Commentary
Scott Perry, President and Chief Executive Officer of Centerra stated, “We had another safe quarter at our operations and construction sites as our employees embrace our Work Safe – Home Safe program. We continue to roll out phase two of the program as we drive to zero harm within the work place.”
In the quarter, the Board of Directors approved a two-year 60,000 metre drill program to test potential extensions of gold mineralization along the Kumtor trend. The program is focused within the Central, South-West and Sarytor pits and the North-East Target area. A budget of $18 million has been allocated to the program with $6.5 million for 2018 and $11.5 million budgeted for 2019.
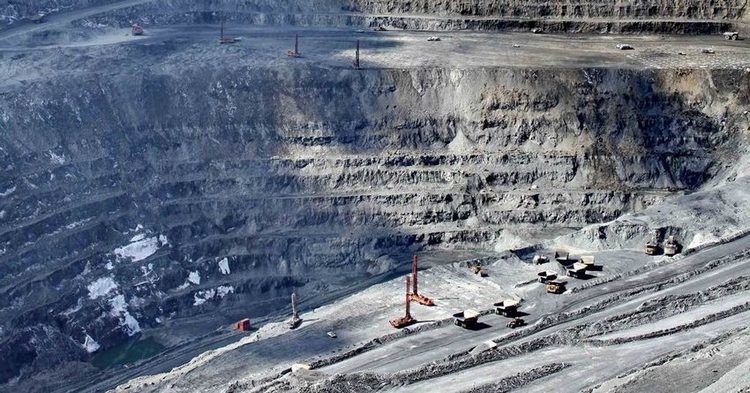
The Kumtor open pit mine, located in the Kyrgyz Republic, is one of the largest gold mines in Central Asia operated by a Western-based gold producer. It has been operating since May 1997 and has produced over 11.7 million ounces or 363.4 tonnes of gold to June 30, 2018.
Kumtor Gold Company is the operator of the Kumtor Project responsible for the entire production cycle.
Centerra Gold Inc. is a Canadian-based gold mining company focused on operating, developing, exploring and acquiring gold properties in North America, Asia and other markets worldwide, and is the largest Western-based gold producer in Central Asia. Centerra operates two flagship assets, the Kumtor Mine in the Kyrgyz Republic and the Mount Milligan Mine in British Columbia, Canada and is building its third gold mining operation, the 100%-owned Öksüt Gold Mine in Turkey. Centerra’s shares trade on the Toronto Stock Exchange (TSX) under the symbol CG. The Company is headquartered in Toronto, Ontario, Canada.
The Kyrgyz Republic, via Kyrgyzaltyn JSC, is Centerra's largest shareholder owning 77,401,766 common shares.
As of August 13, 2018, Kyrgyzstan's interests were estimated at $349 million.
Additional information on Centerra and the full text of the news release on the second quarter 2018 are available on SEDAR at www.sedar.com and the corporate websites at www.centerragold.com and www.kumtor.kg.