Gold production at Kumtor mine in 2018 was 534,563 ounces or 16,626.78 kg. Public Relations Department at Kumtor Gold Company reports.
Gold sales in 2018 were 530,448 ounces (one Troy ounce equals to 31.103 48 grammes) or 16,498.79 kg with a revenue totaling $660.1 million. Contribution in to the national budget in taxes and mandatory payments in 2018 is more than 9.6 billion soms.
Operating results
|
(US$ millions, except as noted) |
Three months ended December 31, |
Year ended December 31, |
||||||||
|
2018 |
2017 |
% Change |
2018 |
2017 |
% Change |
|||||
|
Financial Highlights: |
|
|
|
|
|
|
||||
|
Revenue - $ millions |
246.9 |
228.1 |
8% |
660.1 |
685.2 |
(4%) |
||||
|
|
|
|
|
|
|
|||||
|
Cost of sales (cash) |
57.7 |
44.9 |
28% |
195.3 |
146.0 |
34% |
||||
|
Cost of sales (non-cash) |
51.3 |
39.7 |
29% |
154.6 |
145.7 |
6% |
||||
|
Cost of sales (total) |
109.0 |
84.7 |
29% |
349.9 |
291.7 |
20% |
||||
|
|
|
|
|
|
|
|||||
|
Cost of sales - $/oz sold 4 |
536 |
468 |
14% |
660 |
530 |
24% |
||||
|
|
|
|
|
|
|
|||||
|
Cash provided by operations |
149.6 |
151.0 |
(1%) |
291.0 |
416.1 |
(30%) |
||||
|
Cash provided by operations before changes in working capital 4 |
144.1 |
145.0 |
(1%) |
345.0 |
424.3 |
(19%) |
||||
|
|
|
|
|
|
|
|||||
|
Operating Highlights: |
|
|
|
|
|
|
||||
|
Tonnes mined - 000s |
47,965 |
50,770 |
(6%) |
180,331 |
181,878 |
(1%) |
||||
|
Tonnes ore mined – 000s |
2,235 |
2,607 |
(14%) |
7,356 |
5,084 |
45% |
||||
|
Average mining grade - g/t |
3.94 |
2.30 |
71% |
3.26 |
2.12 |
54% |
||||
|
Tonnes milled - 000s |
1,445 |
1,668 |
(13%) |
6,325 |
6,246 |
1% |
||||
|
Average mill head grade - g/t |
5.49 |
3.76 |
46% |
3.29 |
3.58 |
(8%) |
||||
|
Mill Recovery - % |
87.5% |
80.4% |
9% |
79.3% |
79.1% |
0% |
||||
|
Mining costs - total ($/t mined material) |
1.12 |
1.08 |
4% |
1.17 |
1.10 |
6% |
||||
|
Milling costs ($/t milled material) |
12.70 |
9.16 |
39% |
10.65 |
10.69 |
(0%) |
||||
|
|
|
|
|
|
|
|||||
|
Gold produced – ounces |
228,096 |
158,165 |
44% |
534,563 |
562,749 |
(5%) |
||||
|
Gold produced – kg |
7,094.58 |
4,919.49 |
44% |
16,626.78 |
17,503.46 |
(5%) |
||||
|
Gold sold – ounces |
203,388 |
180,703 |
13% |
530,448 |
550,134 |
(4%) |
||||
|
Gold sold – kg |
6,326.08 |
5,620.50 |
13% |
16,498.79 |
17,111.09 |
(4%) |
||||
|
Average realized gold price 4- $/oz sold |
$ |
1,214 |
$ |
1,262 |
(4%) |
$ |
1,244 |
$ |
1,245 |
(0%) |
|
|
|
|
|
|
|
|||||
|
Capital Expenditures (sustaining) 4- cash |
11.8 |
16.5 |
(28%) |
43.7 |
60.6 |
(28%) |
||||
|
Capital Expenditures (growth) 4- cash |
2.9 |
7.1 |
(59%) |
16.7 |
18.1 |
(8%) |
||||
|
Capital Expenditures (stripping) - cash |
26.3 |
24.4 |
8% |
103.9 |
149.4 |
(30%) |
||||
|
Capital Expenditures (stripping) - non-cash |
9.7 |
7.5 |
30% |
34.9 |
50.9 |
(31%) |
||||
|
Capital expenditures (total) |
50.8 |
55.5 |
(8%) |
199.2 |
279.0 |
(29%) |
||||
|
|
|
|
|
|
|
|||||
|
Operating Costs (on a sales basis) |
57.7 |
44.9 |
28% |
195.3 |
146.0 |
34% |
||||
|
|
|
|
|
|
|
|||||
|
All-in sustaining costs (including taxes) 4 |
138.0 |
127.4 |
8% |
461.1 |
480.6 |
(4%) |
||||
|
|
|
|
|
|
|
|||||
|
Adjusted operating costs 4- $/oz sold |
$ |
319 |
$ |
298 |
7% |
$ |
413 |
$ |
313 |
32% |
|
Operating Costs (on a sales basis)- $/oz sold4 |
$ |
286 |
$ |
247 |
16% |
$ |
370 |
$ |
263 |
40% |
|
Gold - All-in sustaining costs on a by-product basis - $/oz sold4 |
$ |
508 |
$ |
526 |
(3%) |
$ |
694 |
$ |
698 |
(1%) |
|
Gold - All-in sustaining costs on a by-product basis (including taxes) - $/oz sold4 |
$ |
679 |
$ |
705 |
(4%) |
$ |
869 |
$ |
874 |
(1%) |
4- Non-GAAP measures and are discussed under “Non-GAAP Measures” in Centerra Gold’s MD&A and news release dated February 22, 2019
5- Financial data extracted from Centerra Gold’s news release dated February 22, 2019
Production
Total waste and ore mined in 2018 was 180.3 million tonnes compared to 181.9 million tonnes in 2017, representing a slight decrease of 1%.
Operating costs and all-in measures
Operating costs (on a sales basis), including capitalized stripping, increased in 2018 by $3.8 million to $299.2 million compared to $295.4 million in 2017. The movements in the major components of operating costs (mining, milling and site support), including capitalized stripping, is explained below.
Mining costs, including capitalized stripping, totalled $211.1 million in 2018 compared to $199.8 million in 2017. Increased costs in 2018 include higher diesel fuel costs ($21.4 million), which was due to higher fuel prices and higher consumption resulting from increased haulage distances. This was partially offset by lower maintenance cost on the haul trucks and the Liebherr shovels in 2018 as compared to 2017, lower camp catering costs and benefits from continuous improvement initiatives.
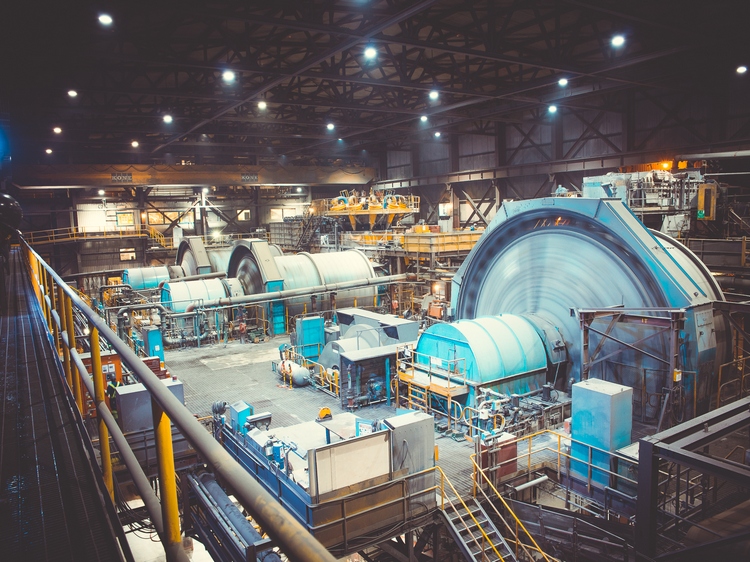
Milling costs totaled $67.3 million in 2018 compared to $66.7 million in 2017. This increase is attributable to higher reagents and consumables costs due to higher mill throughput. These were partially offset by lower maintenance costs ($3.3 million).
Site support costs in 2018 totalled $51.7 million compared to $45.1 million in the comparative year. This increase is attributable to camp charges which ceased to be allocated to mining and milling activities starting in 2018, partially offset by lower insurance premiums.
Other cost movements
Depreciation, depletion and amortization (“DD&A”) associated with sales increased to $154.6 million in 2018 from $145.7 million in the comparative period, mainly due to higher amortization of capitalized stripping associated with the early release of high-grade ore from cut-back 18.
All-in sustaining costs on a by-product basis per ounce sold, which excludes revenue-based tax, was $694 in 2018 compared to $698 in 2017. The decrease was mainly due to lower capitalized stripping costs and decreased sustaining capital expenditures, partially offset by fewer ounces sold.
Including revenue-based taxes, all-in sustaining costs on a by-product basis per ounce sold was $869 in 2018 compared to $874 in the comparative year. The decrease was mainly due to lower all-in sustaining costs and lower revenue-based taxes resulted from decreases sales revenue in 2018.
2018 Exploration update
During the fourth quarter of 2018, exploration drilling programs continued with the completion of sixty diamond drill holes for 15,239 metres. A total of 24,381 metres in ninety-two drill holes were completed in 2018, including 2,308 metres of infill drilling in the SB Zone. Exploration drilling focused on testing zones of mineralization near the surface for the north-east side of the Central Pit, at the corridor between the Central and Southwest pits, and on the flanks of the Northeast target area.
Kumtor’s contributions in taxes and mandatory payments for the twelve months of 2018
|
As of December 31, 2018. |
USD |
|
|
||
|
Q1 2018 |
Q2 2018 |
Q3 2018 |
Q4 2018 |
Total |
|
|
Gross Proceeds Tax |
21,991,326 |
20,026,766 |
14,287,954 |
44,370,588 |
100,676,633 |
|
Issyk-Kul Development Fund |
2,458,948 |
1,540,520 |
1,099,073 |
2,211,982 |
7,310,523 |
|
Pollution tax |
310,000 |
- |
- |
- |
310,000 |
|
Employee Income tax |
1,370,596 |
1,014,540 |
979,727 |
3,068,656 |
6,433,519 |
|
Social Insurance Fund |
6,189,424 |
5,297,461 |
5,049,342 |
4,745,244 |
21,281,472 |
|
Customs |
109,840 |
128,888 |
79,398 |
76,959 |
395,084 |
|
Tax on nonresident companies |
119,640 |
82,315 |
35,128 |
77,543 |
314,626 |
|
Other taxes and mandatory payments |
106,011 |
109,511 |
160,520 |
1,257,385 |
1,633,427 |
|
Total |
32,655,784 |
28,200,003 |
21,691,142 |
55,808,357 |
138,355,286 |
|
US$ official exchange rate to the Kyrgyz Soms as of end of Quarter |
68.4325 |
68.0600 |
69.2773 |
69.8500 |
- |
|
Equivalent of payments effected in thousand Kyrgyz Soms |
2,234,717 |
1,919,292 |
1,502,704 |
3,898,214 |
9,554,927 |
Note: Under the Agreement on New Terms dated as of April 24, 2009, the revenue-based tax and contributions to the Issyk-Kul Region Development Fund are estimated based on actual cash revenues from sales during the period under review.
Payments within the Kyrgyz Republic
Contributions made within the Kyrgyz Republic in 2018 (including taxes, refining, domestic suppliers, infrastructure, charities, etc.) have exceeded US $ 301.938 million.
In all, contributions made within the Kyrgyz Republic between 1994 and 2018 have exceeded US $ 3,774.38 million.
|
USD millions |
2018 |
1994 – 2018 |
|
Taxes, customs & other mandatory payments |
109.040 |
1,192.929 |
|
Social Insurance Fund |
21.281 |
209.126 |
|
Issyk-Kul Development Fund |
7.311 |
69.945 |
|
Licenses & permits |
0.414 |
4.223 |
|
Pollution tax and payments to the Environment Protection Agency |
0.310 |
5.609 |
|
Payments to Kyrgyzaltyn |
0.399 |
13.739 |
|
Refinery |
4.809 |
60.074 |
|
Revenue from the sale of Centerra shares |
- |
86.000 |
|
Dividends |
- |
93.315 |
|
Purchases in the Kyrgyz Republic: - supplies & services |
63.020 |
834.747 |
|
- foods |
4.326 |
73.866 |
|
Kyrgyz-infrastructure-related payments: - electricity |
13.083 |
192.553 |
|
- roads outside the mine site |
1.669 |
46.156 |
|
- Tamga-Kumtor power-transmission line |
- |
41.612 |
|
KGC employees' net wage |
73.715 |
769.342 |
|
Sanatoria treatment |
- |
0.744 |
|
Education, scholarships & training |
0.327 |
6.725 |
|
Sponsorships & sustainable development projects |
2.234 |
31.273 |
|
Government contributions |
- |
31.000 |
|
Settelements |
- |
7.000 |
|
Payments to communities |
- |
4.400 |
|
Total |
301.938 |
3,774.38 |
Kumtor's impact on the macroeconomic performance of the Kyrgyz Republic
According to preliminary reports of the Kyrgyz Republic National Statistics Committee,- Kumtor's share in Kyrgyz Republic’s GDP in 2018 was 8.6%;
- Kumtor's share in the aggregate industrial output was 18.4%.
Commentary
Scott Perry, President and Chief Executive Officer of Centerra Gold stated, “Kumtor had another strong year exceeding its revised production guidance and beating its all-in-sustaining cost guidance, delivering 534,563 ounces of gold production at an all-in-sustaining cost on a by-product basis of $694 per ounce sold."
Gold production at Kumtor is expected to be evenly weighted for the first three quarters of 2019 with the fourth quarter representing approximately 28% of the full year’s gold production forecast.
Scott Perry
“The Company continued to work with the Government of the Kyrgyz Republic to satisfy the conditions precedent to completion of the comprehensive settlement agreement entered into with the Government on September 11, 2017. The longstop date for satisfaction of all such conditions was extended a number of times by agreement of all parties and is now May 31, 2019.”
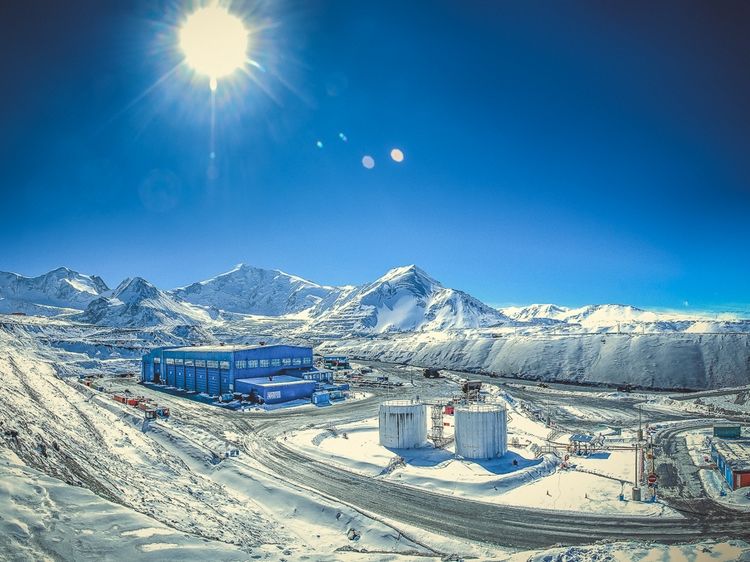
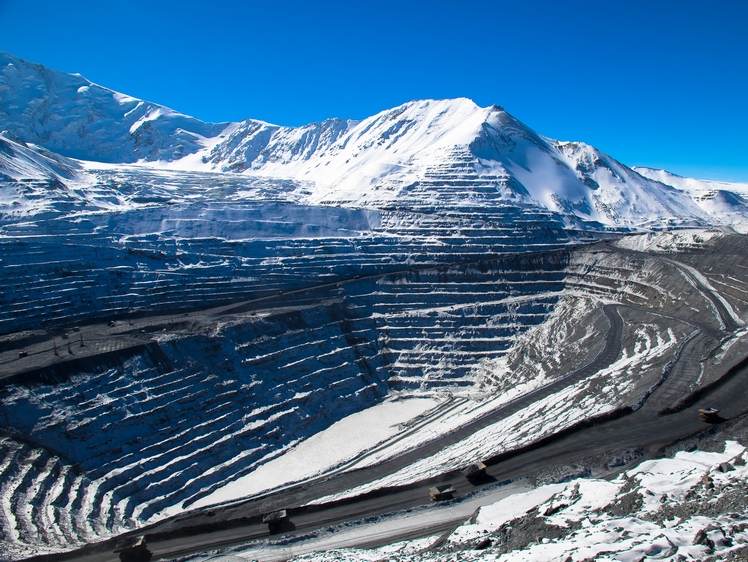
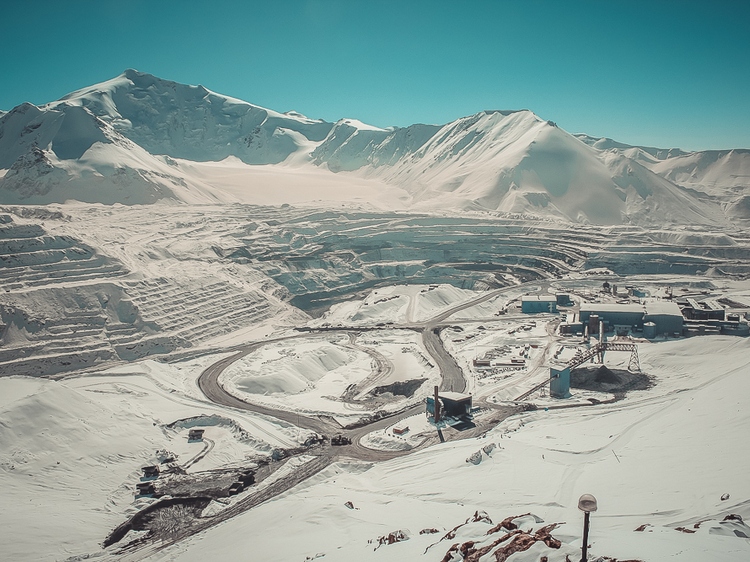
The Kumtor open pit mine, located in the Kyrgyz Republic, is one of the largest gold mines in Central Asia operated by a Western-based gold producer. It has been operating since May 1997 and has produced over 12 million ounces or 374.31 tonnes of gold to December 31, 2018.
Kumtor Gold Company is the operator of the Kumtor Project responsible for the entire production cycle.
Centerra Gold Inc. is a Canadian-based gold mining company focused on operating, developing, exploring and acquiring gold properties in North America, Asia and other markets worldwide and is the largest Western-based gold producer in Central Asia. Centerra operates two flagship assets, the Kumtor Mine in the Kyrgyz Republic and the Mount Milligan Mine in British Columbia, Canada and is currently building its next gold mine, the Öksüt Gold Mine in Turkey. Centerra Gold's shares trade on the Toronto Stock Exchange (TSX) under the symbol CG. The Company is based in Toronto, Ontario, Canada.
The Kyrgyz Republic, via Kyrgyzaltyn JSC, is Centerra Gold's largest shareholder owning 77,401,766 common shares.
As of March 19, 2019, Kyrgyzstan's interests were estimated at $ 404 million.
Additional information on Centerra Gold Inc. and the full text of the news release on the Fourth Quarter and 2018 Year-end Results are available on SEDAR at www.sedar.com and the corporate websites at www.centerragold.com and www.kumtor.kg.